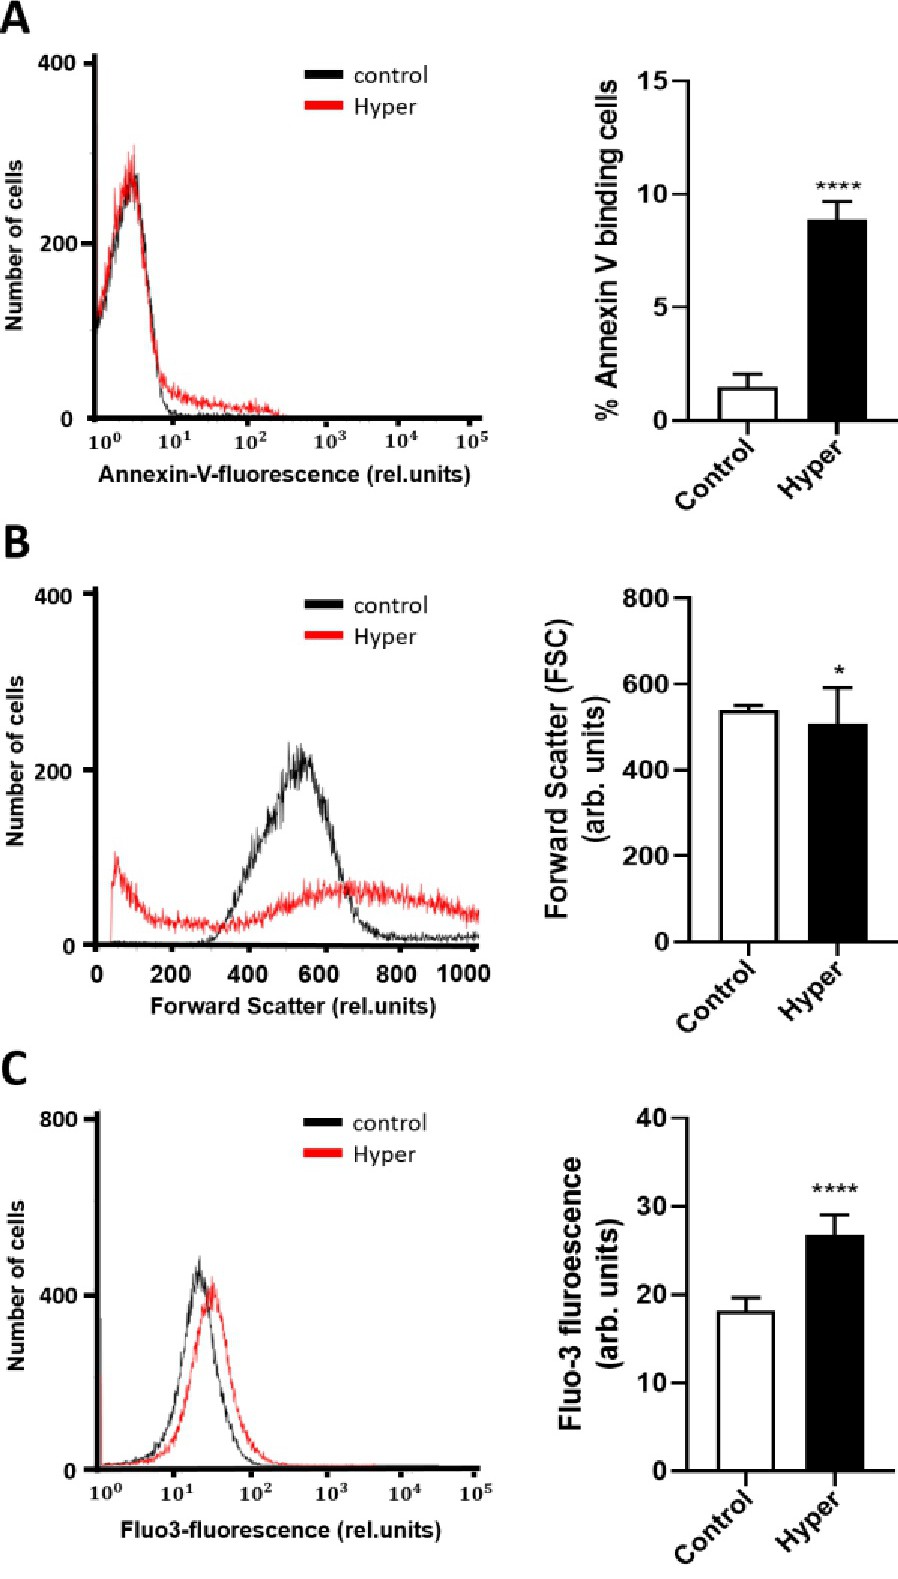
Fig. 2. A. Effect of hyperosmotic shock on the percentage of annexin V binding erythrocytes. Original histogram and arithmetic means ± SEM (n = 10) of annexin V binding of erythrocytes following exposure to isosmotic Ringer solution (black line and white bar) and hyperosmotic Ringer (550 mM sucrose added) (red line and black bar). ****(p<0.001) indicates significant difference from the group in the presence of isotonic Ringer (ANOVA). B. Effect of hyperosmotic shock on erythrocyte forward scatter. Original histogram an arithmetic means ± SEM (n = 10) of forward scatter of erythrocytes following exposure to isosmotic Ringer solution (black line and white bar) and hyperosmotic Ringer (550 mM sucrose added) (red line and black bar). *(p<0.05) indicates significant difference from the presence of isotonic Ringer (ANOVA). C. Effect of hyperosmotic shock on cytosolic Ca²⁺ concentration. Original histogram and arithmetic means ± SEM (n = 10) of Fluo3 fluorescence reflecting cytosolic Ca²⁺ concentration in erythrocytes following exposure to isosmotic Ringer solution (black line and white bar) and hyperosmotic Ringer (550 mM sucrose added) (red line and black bar). ****(p<0.001) indicates significant difference from the absence of isotonic Ringer (ANOVA).